Understanding The Results Watch Video
Note that these are results from 2013 for newer results see 2017 results here.
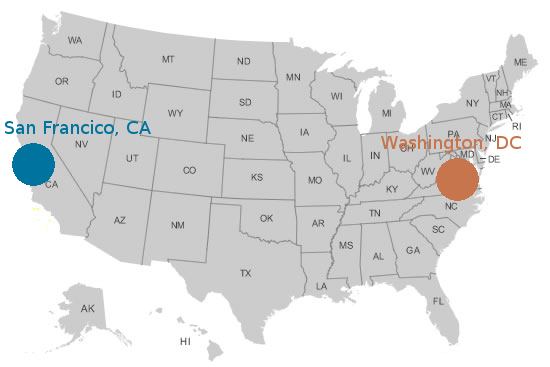
Page load speeds were tested from 100+ websites on each hosting provider. Tests were done from a computer in Washing, DC (orange) and San Fransico, CA (blue). The x-axes shows the time in seconds it took for a web page to load, the y-axes shows the number of websites that loaded a page in a particular amount of time.
| Hosting Service | Speed |
|---|---|
|
Avg:0.48s
Sites Tested:126
|
|
|
Avg:0.58s
Sites Tested:174
|
|
|
Avg:0.79s
Sites Tested:394
|
|
|
Avg:0.82s
Sites Tested:933
|
|
|
Avg:0.96s
Sites Tested:134
|
|
|
Avg:0.97s
Sites Tested:115
|
|
|
Avg:1.29s
Sites Tested:132
|
|
|
Avg:1.55s
Sites Tested:276
|